Proprietary Leadership Intelligence
The Who System™
Personality tests tell you how you think you lead. The Who System measures how your people actually experience your leaders — and how your whole organization is becoming healthier.
“Before you can lead well, you have to know three things: who you are, who you're leading with, and who you're becoming together.”
A multi-source 360 · 12 behavioral traits · grounded in published leadership research
Candor
Blind Spot3.2
Witnesses
6.5
Self
0.84
Consensus
He believes he speaks hard truth. His people, in strong agreement, are still waiting for it. That gap is the whole point.
Beyond the Personality Test
Most assessments answer one question. This one answers three.
DISC and Myers-Briggs stop at self-report: you describe yourself, and the tool hands back a label. The Who System starts where they stop — with the people who actually work alongside your leaders — and asks three questions at three altitudes, from one integrated data engine.
Module 1
Who Am I
“How do others actually experience my leadership, and how accurately do I see myself?”
- Data sources
- Self-rating + 4 to 10 describers across relationship types
- Output
- Personal WHO Profile
Module 2
Who Are We
“What is the behavioral makeup and health of this team?”
- Data sources
- Aggregated member profiles + Team Health Pulse
- Output
- Team WHO Report
Module 3
Who We're Becoming
“Is the whole organization moving toward health and mission?”
- Data sources
- Team rollups + Organizational Pulse
- Output
- Org WHO Dashboard
The Signature Visual
One dial that shows what a whole page of text can't
Every trait is read at a glance on the WHO Ring. It puts the behavior, the self-perception, and the level of agreement in a single picture.
The navy needle. Your Witness Score — what others actually experience, the median inside each relationship class then balanced across classes, so no single group can outvote the rest.
The hollow gold ring. Your Self score. The distance between the ring and the needle is your Harmony gap — overestimation is the highest-risk pattern in the research.
The shaded band. The healthy reference range for that trait. Its opacity is the Observer Consensus: solid means your witnesses agree, faded means they see different leaders.
The colored dots. Individual describers, coded by relationship — supervisor, peer, direct report — small classes greyed to protect anonymity.
Why It's Different
Five design choices you won't find in an off-the-shelf 360
It scores self-awareness, not just behavior
Every trait produces a behavior score and a harmony score — how closely your self-view matches your witnesses. Research shows the gap predicts effectiveness as much as the behavior itself.
It weighs evidence by agreement
A finding only becomes a growth priority when your describers actually converge on it. One critic can never manufacture a constraint, and one fan can never hide one.
It balances rater sources
Supervisors, peers, and direct reports see different leaders. The algorithm computes within-source medians first, so five voices can't outvote two by volume alone.
It rolls up honestly
Team and organizational scores are labeled shared or contested based on whether people actually agree — never averaging disagreement into a false number that describes no one.
It's bidirectional
Every trait can be overdone or underdone. There is no perfect-leader template — only a healthy range and a direction to grow. The dial shows both.
The Behavioral Model
Twelve traits. Three domains. No perfect score.
Every trait is scored on a 0–10 dial with a healthy band, and risk lives at both ends. The goal is never a maximum — it's a range, and a direction. Explore a few and see for yourself.
Tap any trait to see how it reads on the dial
The Inner Life
Proverbs 4:23The Shepherd Life
Ephesians 4:15The Builder Life
1 Corinthians 14:40This is a taste — your full profile walks through all twelve traits in depth, with your real scores.
Now viewing
Candor
Willingness to correct and speak hard truth.
Below the healthy band
Too little
Peacekeeping, avoidance
Too much
Harsh, fault-finding
Every trait carries risk at both ends. There is no perfect score — only a healthy range, and a direction to grow.
What You'll Hold in Your Hands
A report leaders actually want to read
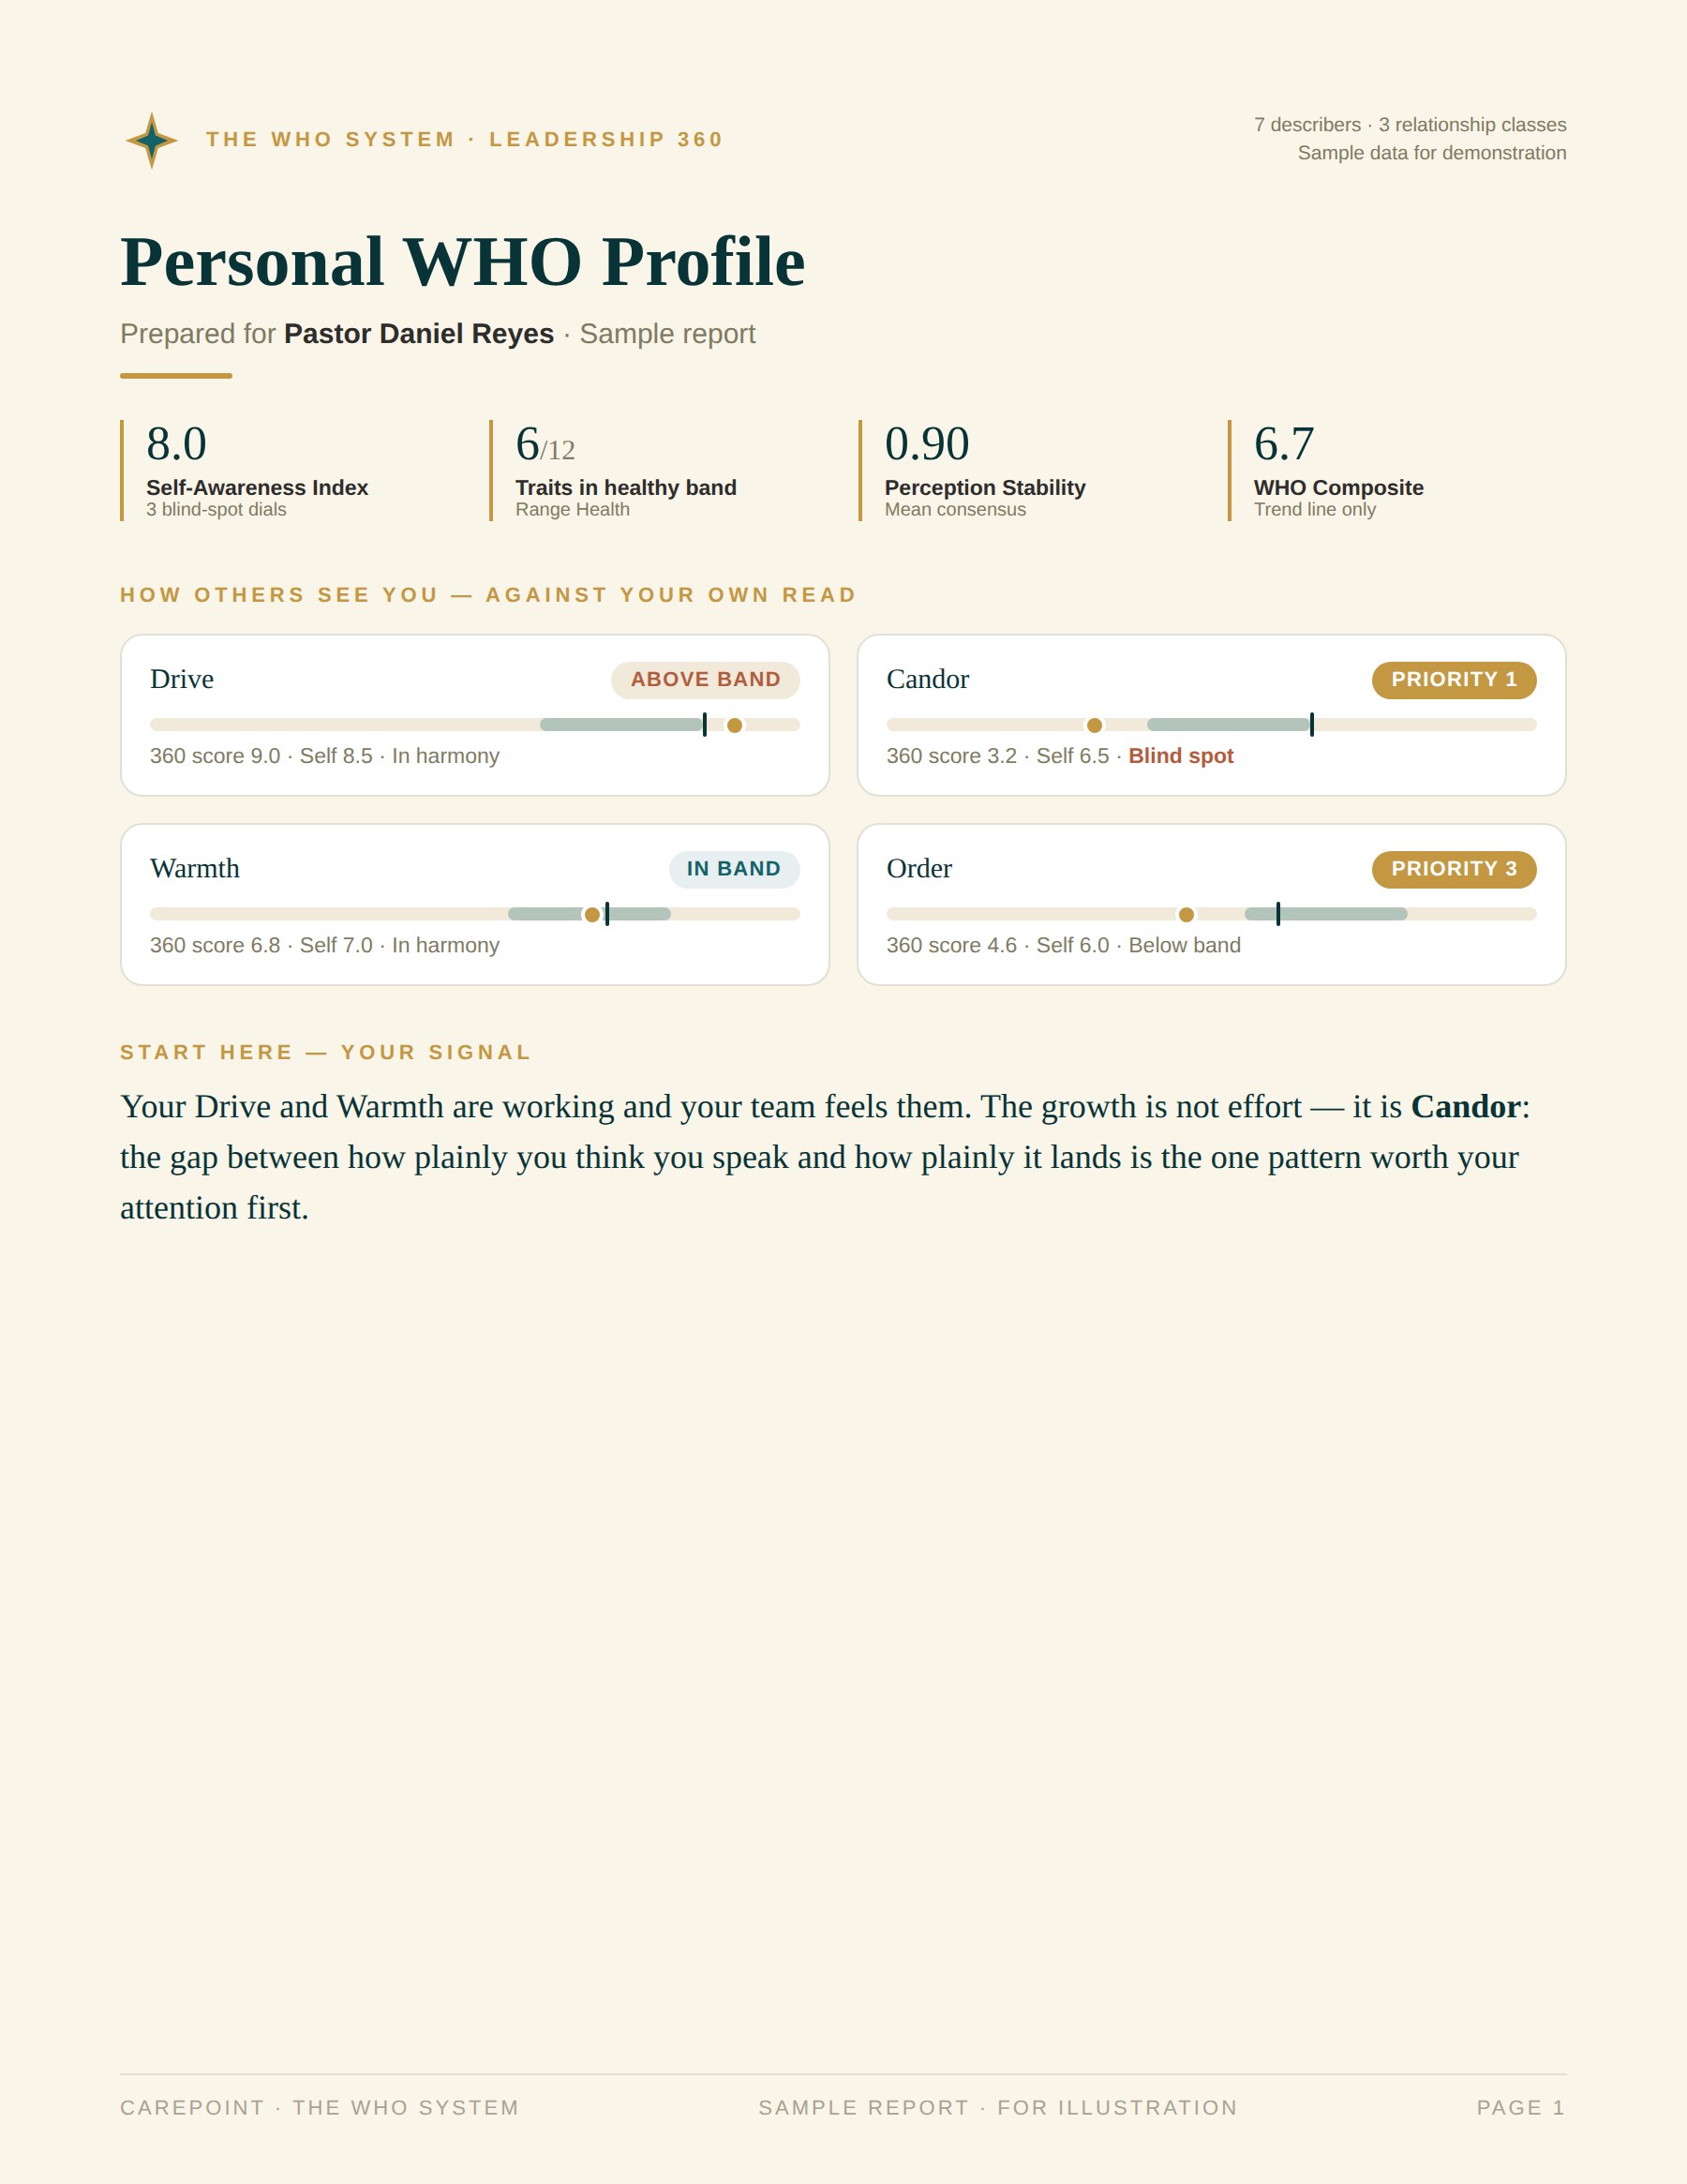
Not a wall of numbers — a guided story. Here is a look at a single leader's dashboard, drawn from sample data.
Personal WHO Profile
Pastor Daniel Reyes
7 describers · 3 relationship classes
Sample data for demonstration
0.0
Self-Awareness Index
3 blind-spot dials
0/12
Traits in healthy band
Range Health
0.00
Perception Stability
Mean consensus
0.0
WHO Composite
Trend line only
Drive
Above BandSelf 8.5 · In Harmony
Candor
Priority 1Self 6.5 · Blind Spot
Warmth
In BandSelf 7.0 · In Harmony
Order
Priority 3Self 6.0 · Below Band
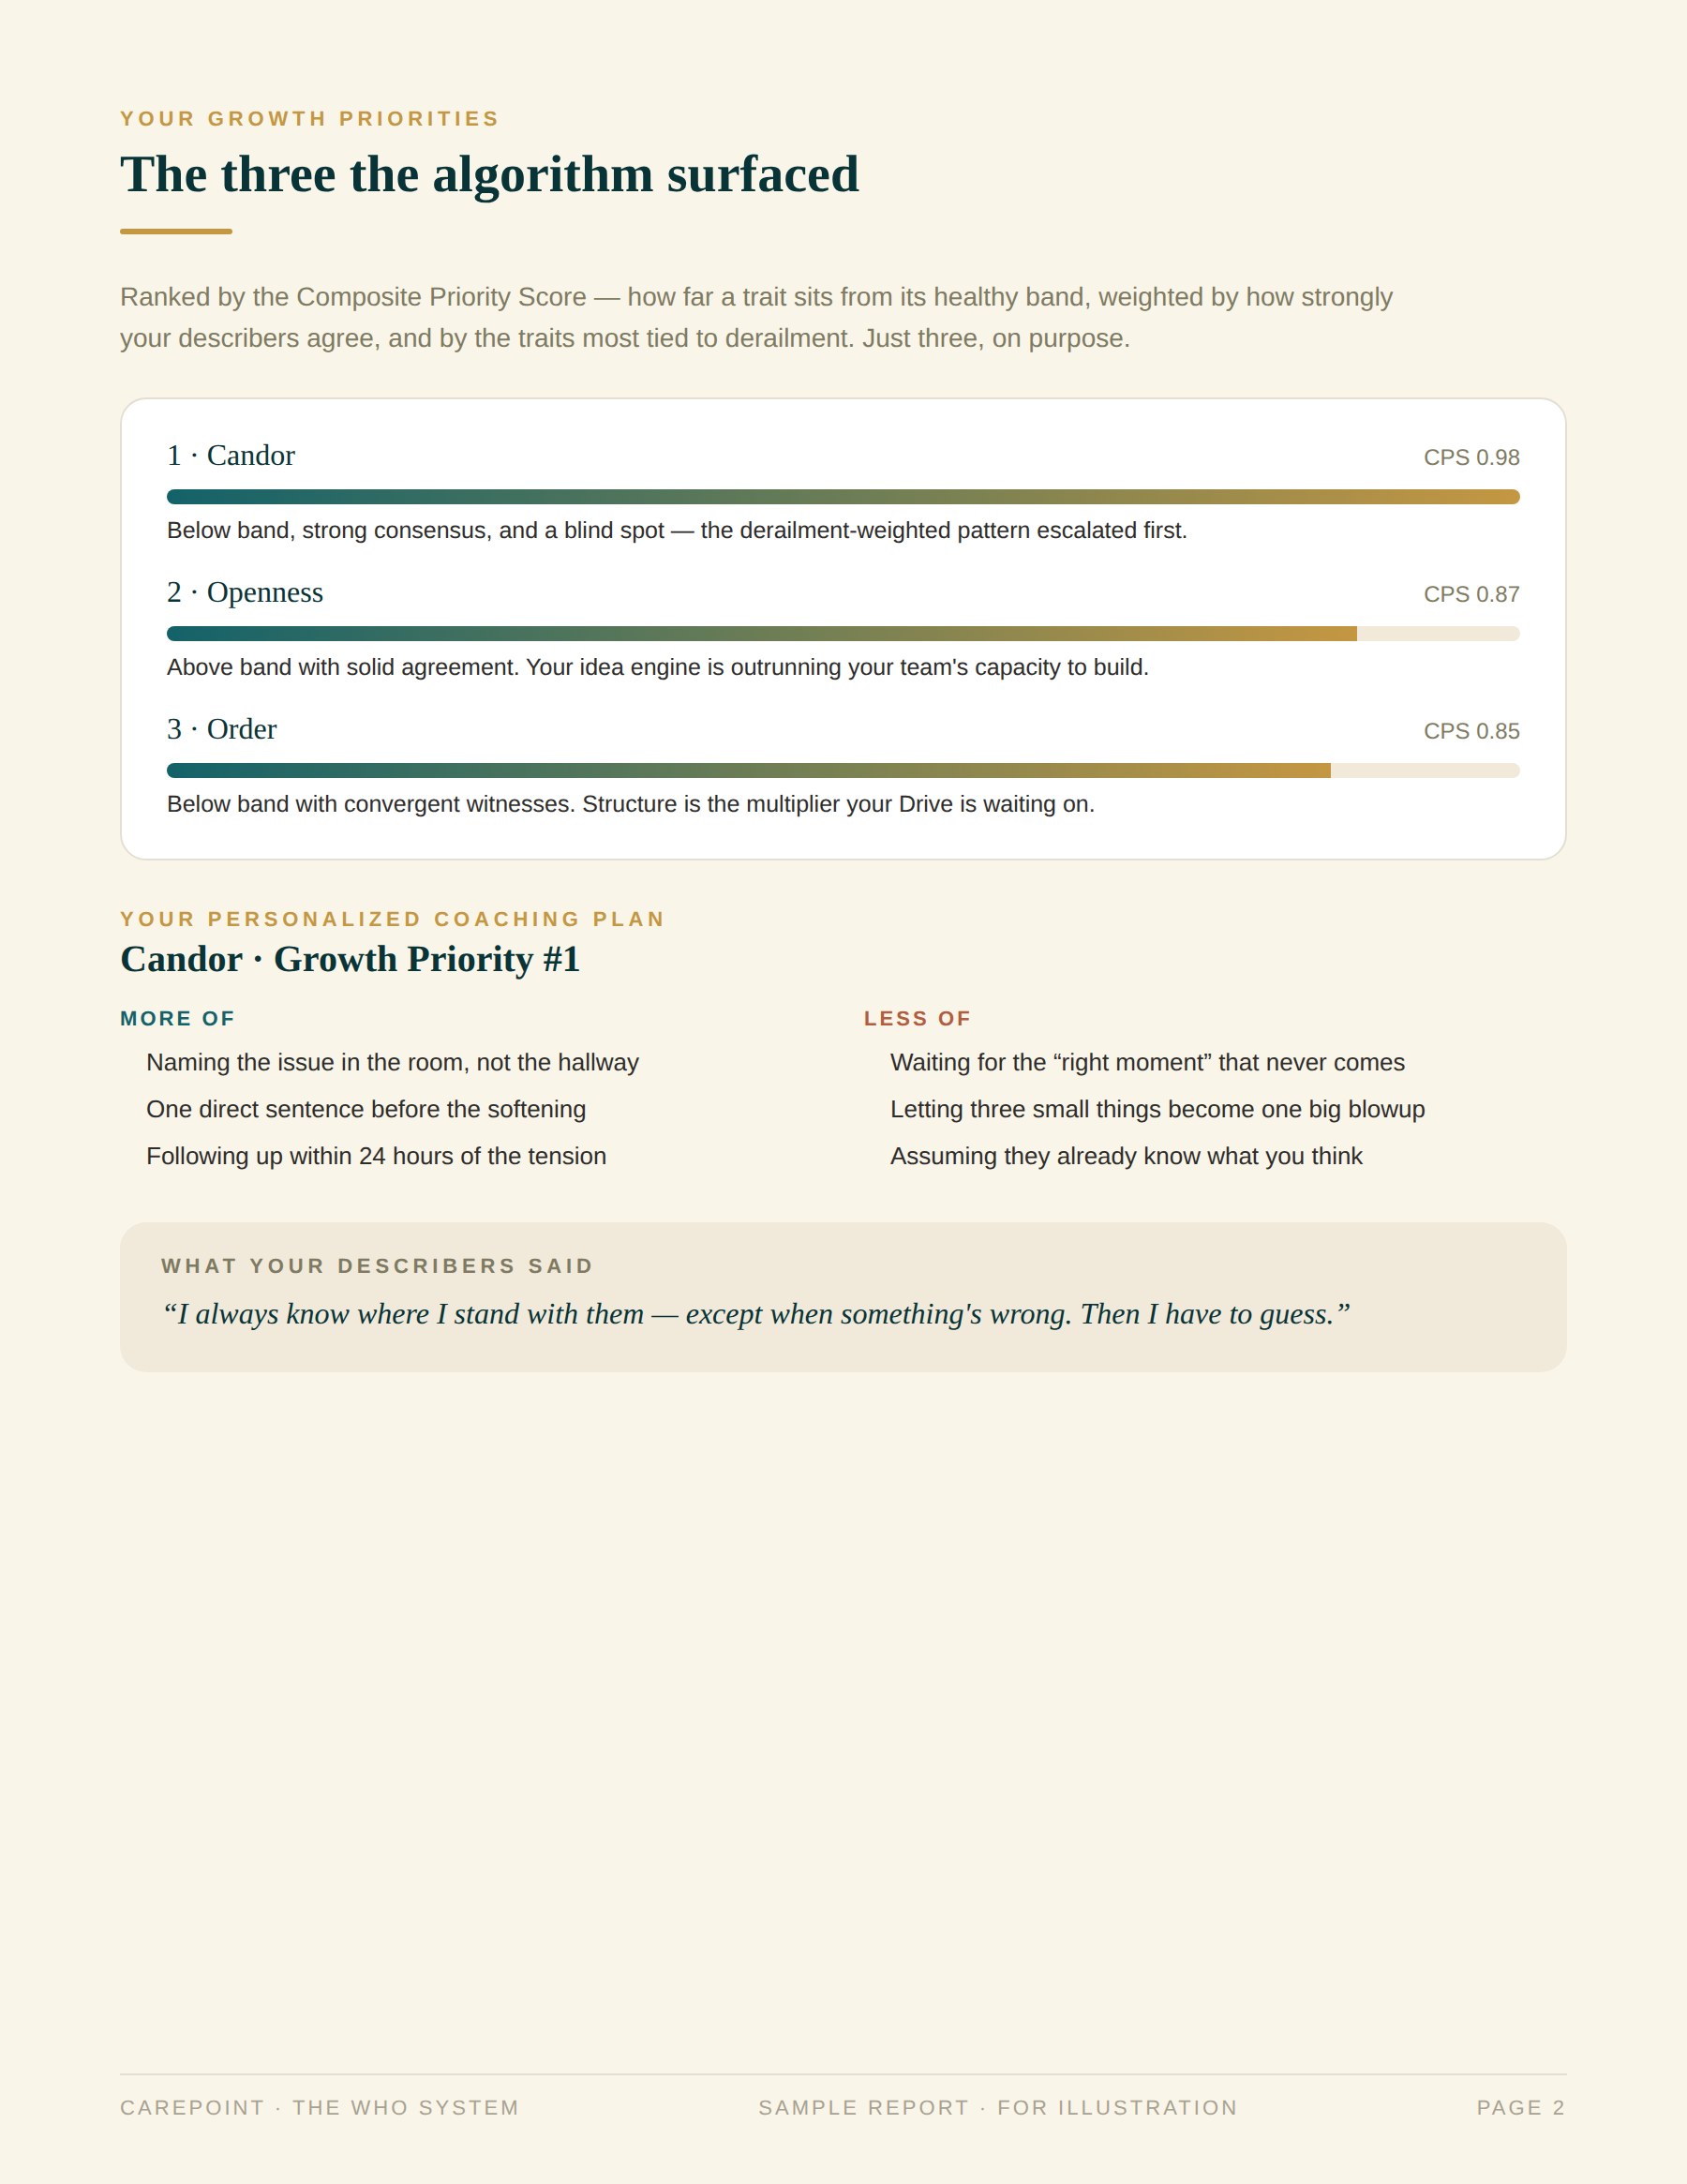
The Headline
Your three Growth Priorities
1. Candor
CPS 0.98
Below band, strong consensus, and a blind spot — the derailment-weighted pattern the algorithm escalates first.
2. Openness
CPS 0.87
Above band with solid agreement. Your idea engine is outrunning your team's capacity to build.
3. Order
CPS 0.85
Below band with convergent witnesses. Structure is the multiplier your Drive is waiting on.
~30 pages
The leader + coach
Personal WHO Profile
Twelve trait pages, Growth Priorities, Self-Awareness Index, anonymized describer quotes, and a guided reflection worksheet.
~10 pages
The team leader
Team WHO Report
Behavioral roster, diversity and coverage gaps, Team Health Pulse marked shared or contested, and a discussion guide.
Live + annual PDF
Senior leadership
Org WHO Dashboard
A heatmap of teams by factor, trend lines, outlier flags, and a leadership-bench signal for where your next leaders are strong.
For the People Who Lead Them
Know exactly how to work with each person
Every profile generates a one-page guide for that person's manager: what motivates them, what drains them, how they come across, and how to speak so they actually hear you. No more guessing what makes someone tick.
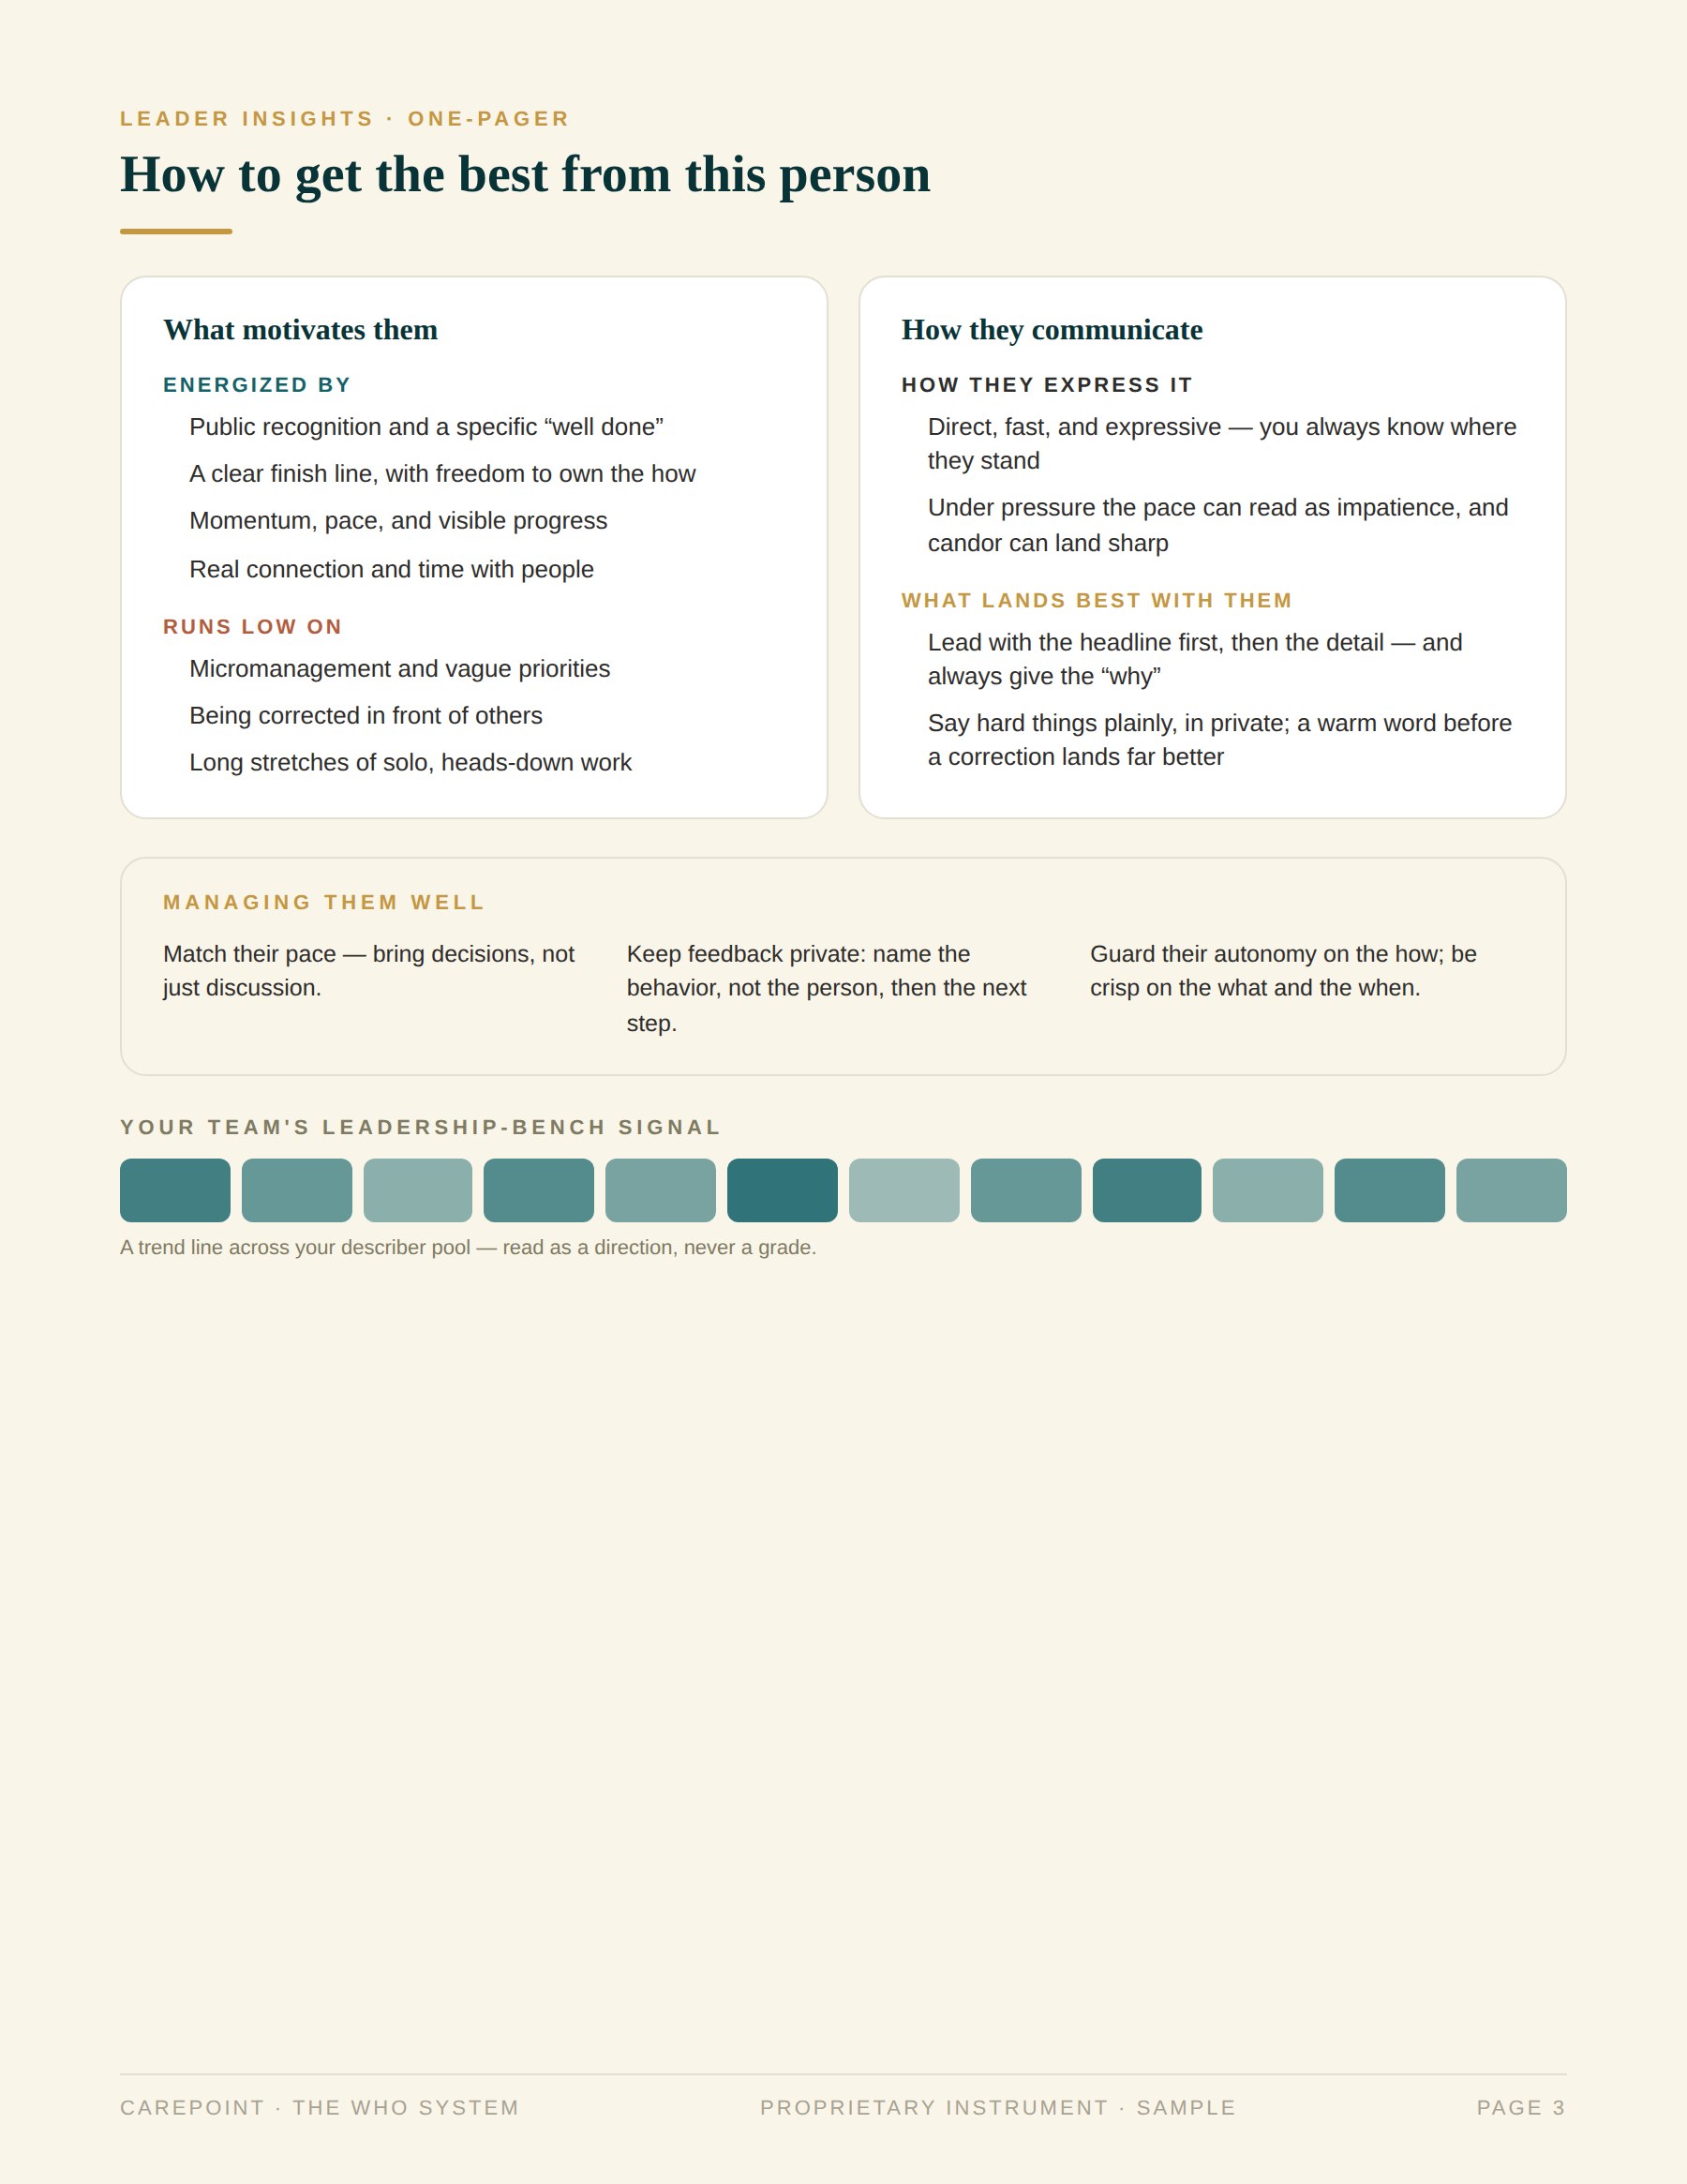
Leader Insights · One-Pager
How to get the best from this person
Auto-generated
from their results
What motivates them
Energized by
- Public recognition and a specific “well done”
- A clear finish line, with freedom to own the how
- Momentum, pace, and visible progress
- Real connection and time with people
Runs low on
- Micromanagement and vague priorities
- Being corrected in front of others
- Open-ended tasks with no deadline
- Long stretches of solo, heads-down work
How they communicate
How they express it
- Direct, fast, and expressive — you always know where they stand
- Under pressure the pace can read as impatience, and candor can land sharp
What lands best with them
- Lead with the headline first, then the detail — and always give the “why”
- Say hard things plainly, in private; a warm word before a correction lands far better than bluntness
Managing them well
- Match their pace — bring decisions, not just discussion
- Keep feedback private: name the behavior, not the person, then the next step
- Guard their autonomy on the how; be crisp on the what and the when
Some people are moved by a bonus, others by a title, a thank-you, or a day off — and some need the hard truth wrapped gently while others want it straight. The one-pager names what actually works for this person, so you lead them as an individual, not a type.
See a Full Sample Report
You've seen the highlights
Here is the whole thing — the profile snapshot, your growth priorities, a personalized coaching plan, and the leader-insights one-pager — as a real sample report.
A sample WHO profile built from demonstration data. Yours is built from your own 360.
Get a full sample report
See a complete WHO profile for yourself. Enter your name, phone, and email and the full sample report is yours to download.
The Research Foundation
Every design choice is grounded in published research
The Who System's architecture rests on four bodies of peer-reviewed leadership and measurement science. This isn't an opinion about leaders — it's a method built on the evidence.
In a study of 1,460 managers, effectiveness was highest when leaders saw themselves accurately or underestimated themselves — and lowest for overestimators. Overestimation is a leading indicator of derailment.
So we compute a Harmony Index per trait and weight blind spots more heavily.
Atwater, Ostroff, Yammarino & Fleenor (1998); Fleenor et al. (2010), The Leadership Quarterly
The multilevel literature is unambiguous: you may only combine individual ratings into a group score after showing that raters actually agree. Averaging disagreement produces a number that describes no one.
So we label items Shared or Contested, and suppress team scores nobody shares.
James, Demaree & Wolf (1984); LeBreton & Senter (2008); Biemann, Cole & Voelpel (2012)
Different rater sources observe genuinely different behavior, and some studies find peers are the single most accurate source for performance-relevant behavior.
So we balance across sources instead of letting the largest group win.
Braddy, Gooty, Fleenor & Yammarino (2014); APA evidence reviews
Best practice favors observable behavioral items over trait adjectives, frequency anchors over agreement anchors, medians over means for small rater pools, and a mandatory debrief for feedback to actually produce change.
So every one of these choices is built into the instrument.
Bracken, Church & Fleenor
Tap any pillar to see the research behind it.
How It Works
From nomination to growth, in five steps
01
Design the panel
The leader nominates 4 to 10 describers spanning supervisors, peers, direct reports, and ministry partners. The supervisor confirms the list, so no one hand-picks only their fans.
02
Everyone rates behavior
Sixty observable behavioral items, about twelve minutes, on a simple frequency scale. Fully anonymous — raw rater-level responses are never shown to anyone.
03
The WHO algorithm scores it
Witness Score, Harmony Index, and Observer Consensus are computed per trait, then a Constraint Priority Score ranks the top three growth priorities — real, agreed-upon, and weighted for blind spots.
04
A coach debriefs the leader
No raw report is ever released without a scheduled debrief with a trained coach. Feedback without facilitation changes little and can wound. This is non-negotiable.
05
Re-measure on cadence
Individual 360 every 12 to 18 months, Team Pulse every 6 months, Org Pulse annually — so growth is tracked over time, never a one-time verdict.
Development, never discipline. Results are never used for credentialing, termination, or public comparison. The full profile is shared at the leader's discretion — because honest feedback is a grace, not a threat.
The Honest Comparison
Why it outperforms a personality test
| The Who System | Typical Personality Test | |
|---|---|---|
| What it measures | Observable leadership behavior, witnessed by the people around you | A self-reported personality type or preference |
| Where the data comes from | Multiple sources — supervisors, peers, direct reports, partners | You, rating yourself, alone |
| Self-awareness | Measured directly as a Harmony Index, per trait | Not measured at all |
| The result | A healthy range and a direction to grow on every trait | A fixed type, color, or four-letter code |
| Evidence standard | Findings must clear a consensus threshold to count | A single respondent, taken at face value |
| Team & organization | Rolls up to team makeup and whole-organization health | Individual snapshot only |
| What you do next | A ranked, weighted growth plan and a coaching debrief | A label to remember |
The Who System is a research-informed, multi-source development instrument. Reference bands are calibrated from ministry judgment and refined against real norms as data accumulates.
Your Next Step
See what your leaders can't see about themselves
Bring The Who System to your church, ministry, or organization. Book a free consultation and we'll walk you through the model, a sample report, and what a rollout would look like for your team.
No cost, no obligation — just a conversation about the leaders you're raising up.